Hot Projects
Is The Bitcoin Price Correction Over? Here’s The Support Level To Watch | MATIC News

Opeyemi is a proficient writer and enthusiast in the exciting and unique cryptocurrency realm. While the digital asset industry was not his first choice, he has remained absolutely drawn since making a foray into the space over two years. Now, Opeyemi takes pride in creating unique pieces unraveling the complexities of blockchain technology and sharing insights on the latest trends in the world of cryptocurrencies.
Opeyemi savors his attraction to the crypto market, which explains why he spends the better parts of his day looking through different price charts. “Looking” is a rather simple way to describe analyzing and interpreting various price patterns and chart formations. However, it appears that is not Opeyemi’s favorite part – in fact, far from it.
Being able to connect what happens on a price chart to on-chain movements and blockchain activities is what keeps Opeyemi ticking. “This emphasizes the intricacies of blockchain technology and the cryptocurrency market,” he would say. Most importantly, Opeyemi thinks of any market insights as the gospel, while recognizing that he is only a messenger.
When he is not clicking away at his keyboard, Opeyemi is most definitely listening to music, playing games, reading a book, or scrolling through X. He likes to think he is not loyal to a particular genre of music, which can be true on many days. However, the fast-rising Afrobeats genre is a staple in Opeyemi’s Spotify Daily Mix.
Meanwhile, Opeyemi is a voracious reader who enjoys a wide category of books – ranging from science fiction, fantasy, and historical, to even romance. He believes that authors like George R. R. Martin and J. K.
Rowling are the greatest of all time when it comes to putting pen to paper. Opeyemi believes his reading of the Harry Potter series twice is proof of that.
Indeed, Opeyemi enjoys spending most of his time within the four walls of his home. However, he also sometimes finds solace in the company of his friends at a bar, a restaurant, or even on a stroll. In essence, Opeyemi’s ambivert (haha! been searching for an opportunity to use the word to describe myself) nature makes him a social chameleon who is able to quickly adapt to different settings.
Opeyemi recognizes the need to constantly develop oneself in order to stay afloat in a competitive and ever-evolving market like crypto. For this reason, he is always in learning mode, ready to pick up the slightest lesson from every situation. Opeyemi is efficient and likes to deliver all that is required of him in time – he believes that “whatever is worth doing at all is worth doing well.” Hence, you will always find him striving to be better.
Ultimately, Opeyemi is a good writer and an even better person who is trying to shed light on an exciting world phenomenon – cryptocurrency. He goes to bed every day with a smile of satisfaction on his face, knowing that he has done his bit of the holy assignment – spreading the crypto gospel to the rest of the world.
Hot Projects
Longest Miner Capitulation Since 2022 Signals Potential Bitcoin Rally Ahead | MATIC News
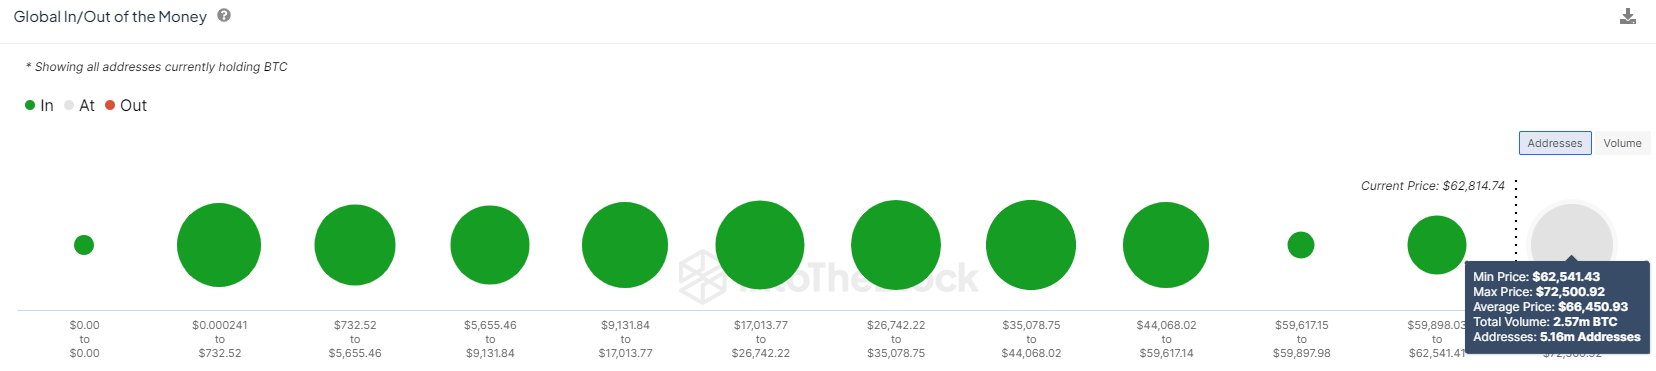
Bitcoin (BTC) has recently struggled to regain bullish momentum, remaining in a consolidation phase just above the crucial $60,000 support. Despite reaching an all-time high three months ago, the largest cryptocurrency witnessed a dip to as low as $59,500 on Wednesday due to increased selling pressure from miners.
BTC Selling Spree
The ongoing miner capitulation, the longest observed since the summer of 2022 before the FTX implosion, indicates the Bitcoin Halving supply-squeeze effect.
Crypto analyst Ali Martinez noted that Bitcoin miners have sold more than 2,300 BTC in the past 3 days, amounting to approximately $145 million.
Related Reading
This selling pressure from miners adds to the recent BTC sales by the US and German governments, contributing to the market’s downward pressure and keeping prices within the lower range of the wider consolidation zone between $60,000 and $70,000 witnessed in recent months.
Notably, addresses linked to the German and US governments have sent $737 million worth of BTC to exchanges, including Coinbase, Bitstamp, and Kraken, in various transactions.
As the selling pressure from governments and miners subsides over time, market observers expect a potential price recovery for BTC, following the typical pattern observed during the post-Halving period, where new all-time highs are often achieved.
Bitcoin Price Outlook
Market expert Scott Melker points out that the market may be nearing a crucial signal, stating that if a daily candle closes below the $60,300 level, it could lead to a bullish divergence.
This would involve the daily RSI (Relative Strength Index) moving out of oversold territory, similar to last August when the price was around $26,000.
Melker emphasizes the need for a close below the mentioned level, followed by a clear upward move in the RSI without making a lower low. It would require a significant downward move for the RSI to go lower than its level on June 24th.
Related Reading
However, crypto analyst Andrew Kang highlights the significance of a potential loss of the four-month range on Bitcoin, drawing parallels with the range observed in May 2021 following a parabolic rally of BTC and altcoins.
Kang notes that over $50 billion in crypto leverage is currently at near all-time highs, compounded by the fact that the market has been in a prolonged consolidation phase for 18 weeks without experiencing extreme washouts, as seen during the 2020-2021 bull market.
Moreover, Kang suggests that initial estimates of the low $50,000s may have been too conservative, and a more significant reset to the $40,000s could be possible.
Such a pullback would substantially impact the market and likely necessitate a few months of choppy or downward price action before a reversal and an upward trend could be established.
At the time of writing, BTC has recovered the $60,350 level after its brief dip below this crucial support for further movements to the upside.
The largest cryptocurrency in the market has erased all gains in wider time frames, and it is currently recording a 12% price decrease in the monthly time frame.
Featured image from DALL-E, chart from TradingView.com
The on-chain analytics firm Santiment has revealed the altcoins that are currently in the historical buy zone according to a fair value model.
A Large Amount Of Altcoins Are Currently Near The Opportunity Zone
In a new post on X, Santiment talked about what the various assets in the cryptocurrency sector are looking like right now based on their Market Value to Realized Value (MVRV) ratios. The MVRV ratio is an indicator that keeps track of the profit/loss status of the addresses on any given network.
When the value of this indicator is greater than 1, it means the investors are carrying a net amount of profits right now. On the other hand, the metric under this threshold implies the dominance of losses in the market.
Naturally, the MVRV ratio being exactly equal to 1 suggests the unrealized loss on the network is exactly equal to the unrealized profit, so the average holder could be considered just breaking even.
Historically, corrections have become more probable when investor profits have ballooned up. Holders become more tempted to sell the larger their gains grow. Similarly, holders getting underwater has facilitated bottom formations, as sellers become exhausted during such conditions.
Based on these facts, Santiment has developed an Opportunity and Danger Zone Model that uses the MVRV ratio’s divergence on different timeframes to estimate better whether an asset is currently providing a buying or selling window.
Now, here is the chart shared by the analytics firm that shows where the different altcoins stand according to this model:
Note that in this model, the zero mark takes the role of the neutral 1 level from the MVRV ratio. Also, the polarity is flipped here, with values under zero implying profit dominance and those above signifying loss.
The graph shows that most of the altcoins are in the positive region right now, suggesting that their investors are underwater. Among these, Basic Attention Token (BAT), Chromia (CHR), and Highstreet (HIGH) particularly stand out as their MVRV divergence exceeds the 1 mark.
Under this model, the region above 1 is called the “Opportunity Zone,” as assets have historically offered the most profitable opportunities while inside it.
While most altcoins are at least slightly undervalued currently, a few, like Ethereum Name Service (ENS), MANTRA (OM), and Reserve Rights (RSR), are in or near the Danger Zone instead. The Danger Zone, which occurs under -1, is the counterpart to the Opportunity Zone, where coins become overvalued.
Ethereum Price
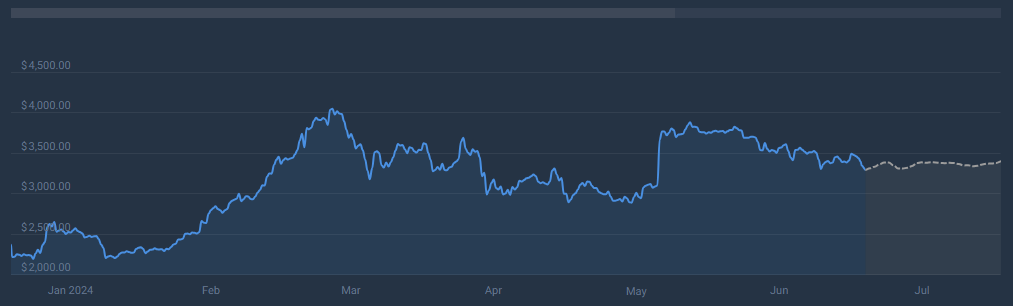
Ethereum, the largest among the altcoins, has faced a plunge of more than 4% in the last 24 hours, which has taken its price under the $3,300 level.
Ethereum (ETH) has become a beacon in the sea of blockchains, boasting a staggering 92% surge in dApp (decentralized application) volume over the past week. This news, however, comes with a layer of complexity, revealing a landscape of both opportunity and potential setbacks for the leading blockchain.
Related Reading
Cheap Gas Fuels The Fire
Analysts attribute the dApp volume explosion to the Dencun upgrade in March, which significantly reduced gas fees – the cost associated with processing transactions on the Ethereum network.
Lower fees have historically enticed users, and this recent development seems to be no different. The surge in activity suggests a revitalized Ethereum, potentially attracting new projects and fostering a more vibrant dApp ecosystem.
NFT Mania Drives The Numbers
While the overall dApp volume (see chart below) paints a rosy picture, a closer look reveals a more nuanced story. The surge appears to be driven primarily by a surge in NFT (Non-Fungible Token) trading and staking activity.
Applications like Blur and Uniswap’s NFT aggregator saw significant hikes, highlighting the booming NFT market on Ethereum. This trend indicates a thriving niche within the Ethereum dApp landscape, but raises questions about the platform’s diversification beyond NFTs.
A Look At User Engagement
A curious wrinkle emerges when examining user engagement metrics. Despite the impressive volume increase, the number of unique active wallets (UAW) on the Ethereum network has actually decreased.
This disconnect suggests that the current activity might be driven by a smaller, more active user base. While high volume is certainly a positive indicator, it’s crucial to see broader user participation to ensure the sustainability of the dApp ecosystem.
A Glimmer Of Hope?
One positive long-term indicator for Ethereum is the trend of decreasing exchange holdings, as reported by Glassnode. This suggests ETH holders are moving their assets off exchanges, potentially reducing sell pressure and contributing to price stability.
If this trend continues, ETH could potentially target reaching $4,000 this quarter or even surpass its all-time high. However, this price prediction remains speculative and depends on various market forces.
Ethereum At A Crossroads
Ethereum finds itself at a crossroads. The Dencun upgrade has demonstrably revitalized dApp activity, particularly in the NFT space. However, the uneven dApp performance and declining UAW raise concerns about the long-term viability of this growth. Network growth, measured by the number of new addresses joining the network, is also slowing down, according to Santiment, potentially hindering wider adoption.
Related Reading
The short-term price outlook for ETH remains uncertain. While the long-term indicators, like decreasing exchange holdings, suggest potential for price appreciation, the network’s growth slowdown might lead to a short-term price dip.
Looking Forward
The coming months will be crucial for Ethereum. The platform needs to capitalize on the renewed interest in dApps by attracting a broader user base and fostering a more diverse dApp ecosystem beyond NFTs. Addressing scalability issues and ensuring user-friendly interfaces will also be key to sustaining growth.
If Ethereum can navigate these challenges, it has the potential to solidify its position as the premier platform for decentralized applications. However, if it fails to adapt, other blockchains waiting in the wings might capitalize on its shortcomings.
Featured image from Pexels, chart from TradingView

Longest Miner Capitulation Since 2022 Signals Potential Bitcoin Rally Ahead | MATIC News

Bittensor proposes burning 10% supply to stabilize TAO following $8 million exploit | MATIC News
These Are The Altcoins In Buy Zone, Analytics Firm Reveals | MATIC News
-
 Hot Projects4 months ago
Bitcoin Blasts Past $70,000 to Register New All-Time High | MATIC News
-
 Latest News4 months ago
Court upholds SEC’s unregistered securities claims against Gemini, Genesis’ Earn program | MATIC News
-
Hot Projects2 months ago
Bitcoin Will Be Set For New ATHs If It Breaks This Resistance: Analyst | MATIC News
-
 Latest News2 months ago
Six Coinbase customers claim the exchange is violating securities laws in new lawsuit | MATIC News
-
 Hot Projects3 months ago
Bitcoin ETF Inflows Could Eclipse $1 Trillion, Predicts Bitwise CIO | MATIC News
-
 Hot Projects3 months ago
Ondo Finance Joins BlackRock Tokenized Fund As Inflows Surpass $160M | MATIC News
-
 Latest News4 months ago
Over $1 billion wiped off HEX’s valuation following Richard Heart’s disparaging remarks | MATIC News
-
 Hot Projects2 months ago
PEPE Whales Go On Massive 720B Shopping Spree Amid Campaign For New ATHs, Is It Time To Get In? | MATIC News