Hot Projects
Why Is Bitcoin Price Down Today? 3 Key Reasons | MATIC News
Today’s Bitcoin price movement is a confluence of factors including massive liquidations, macroeconomic pressures, and the impact of negative Coinbase Premium alongside Bitcoin ETF dynamics. These elements combined have led to a noticeable dip in Bitcoin’s price.
#1 Long Liquidations
Today’s Bitcoin market saw a significant price drop, initiated by a sweeping liquidation event on the futures market. Over the last 24 hours, crypto trader liquidations exceeded $682.54 million across more than 191,000 traders, according to Coinglass data.
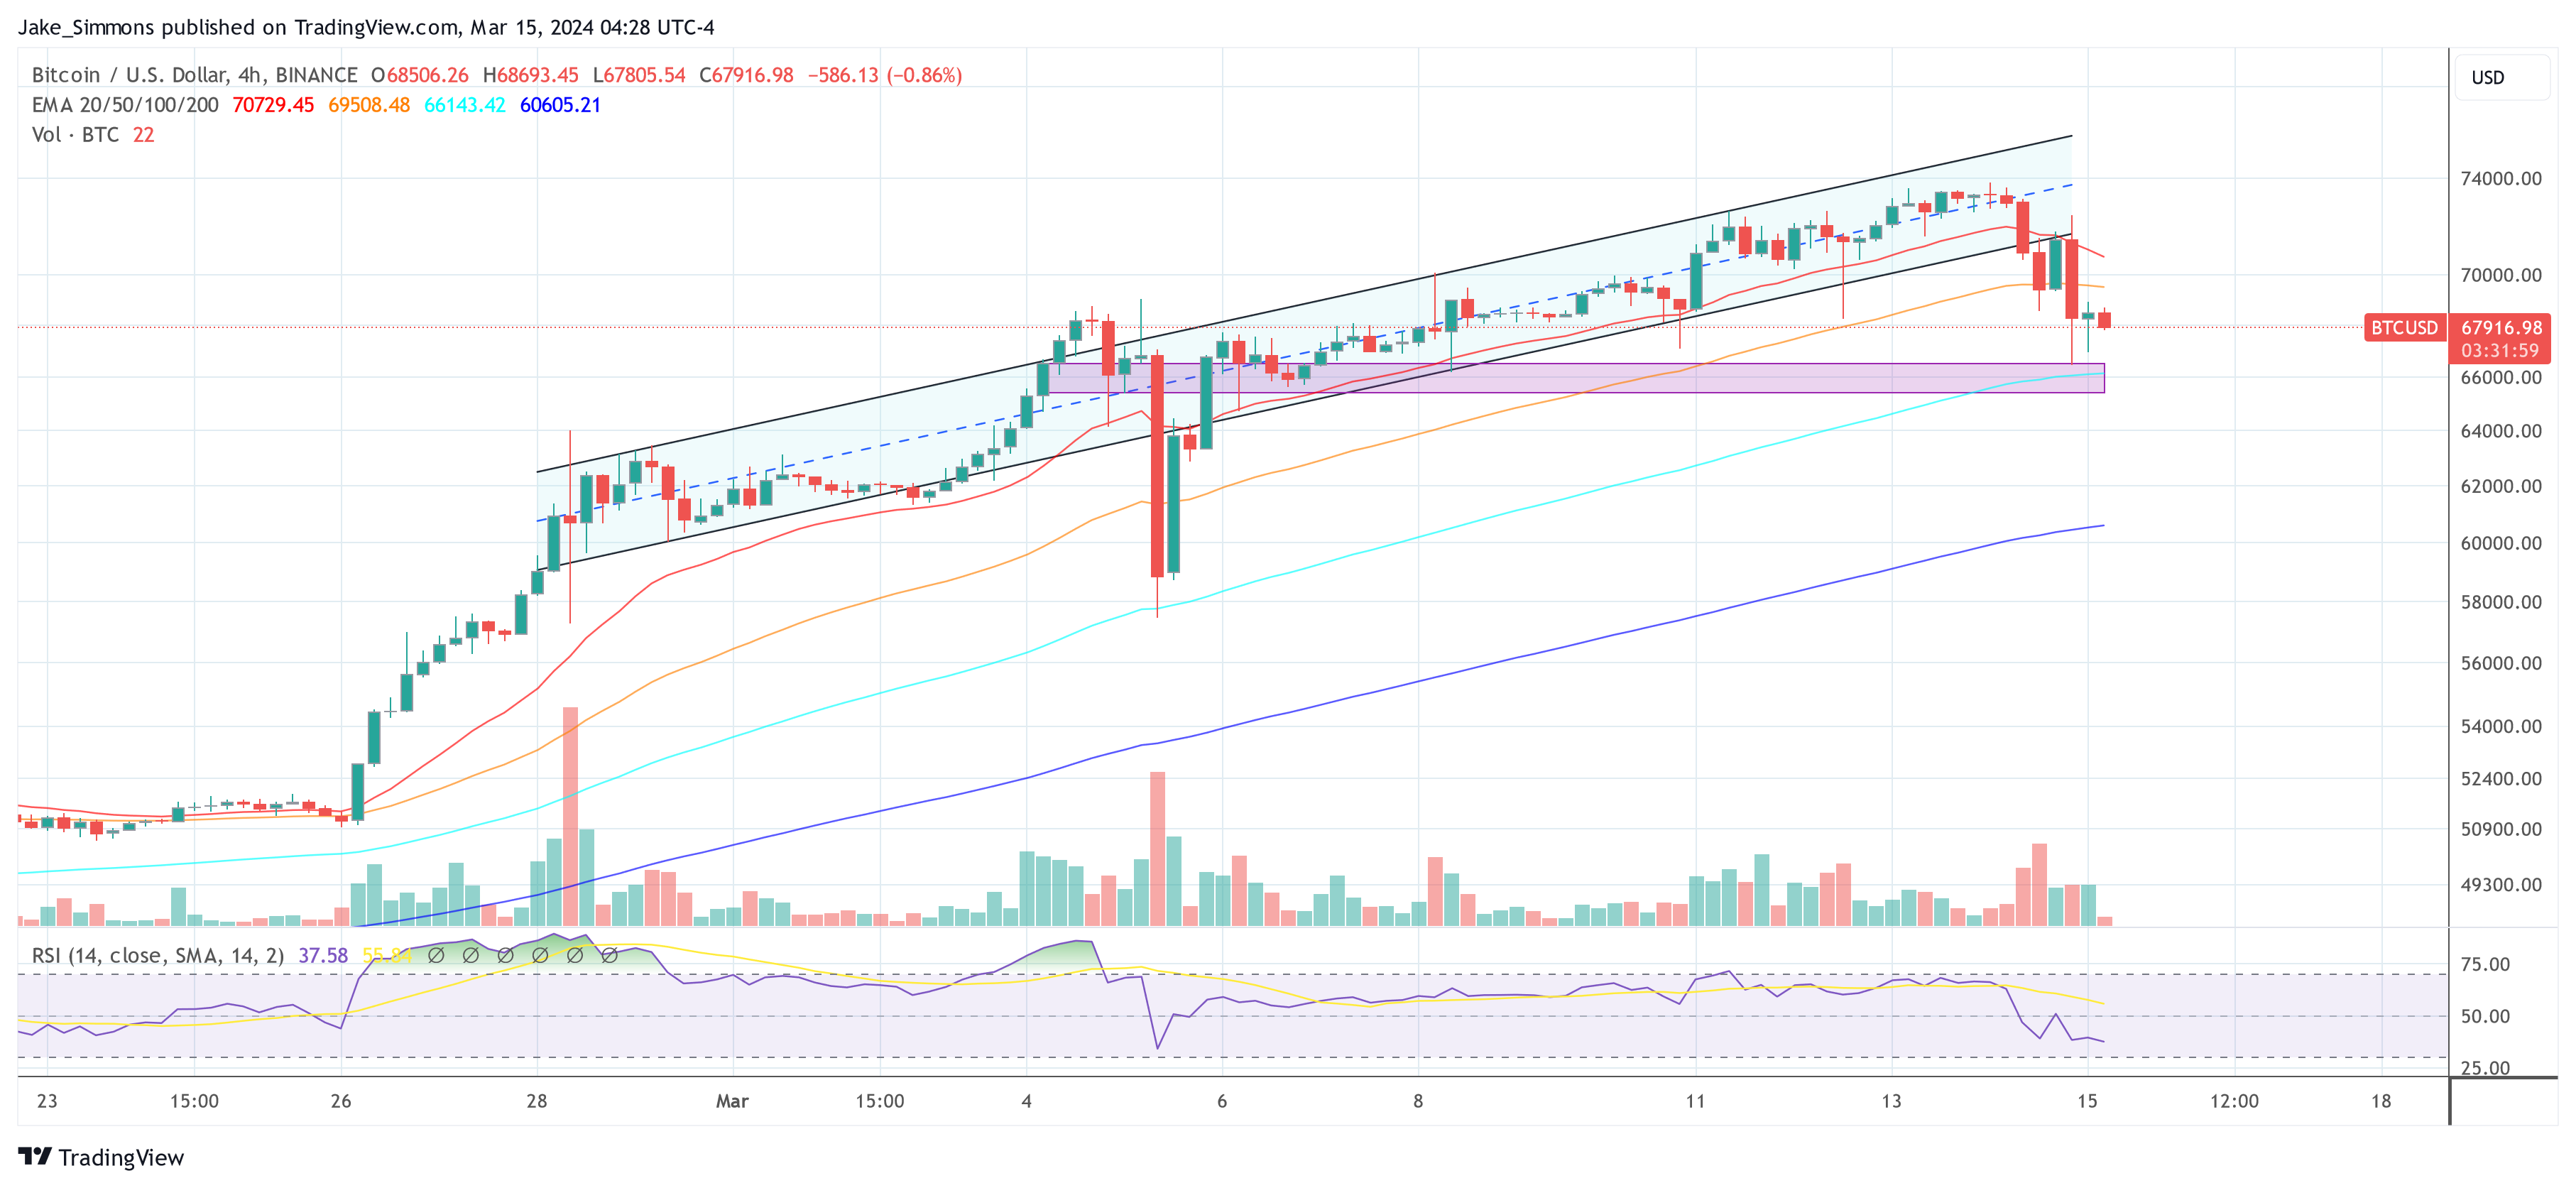
This surge in liquidations resulted in Bitcoin’s price plummeting by 8% in mere hours, falling from $72,000 to $66,500. Although there was a minor recovery, with Bitcoin’s price rebounding to the $68,000 level, it currently stands nearly 10% below its March 14 all-time high of $73,737.
A notable 80% of these liquidations were long positions, contributing to $544.99 million of the total. Short position liquidations made up the remaining $136.94 million, with Bitcoin longs alone accounting for $242.37 million in liquidations.
#2 Macro Conditions Weighing On Bitcoin Price
The macroeconomic landscape has placed additional pressure on Bitcoin’s value. Ted, a macro analyst known as @tedtalksmacro, highlighted on X the influence of macro conditions on the cryptocurrency market.
He stated, “If BTC is digital gold, expect it to trade in lockstep with gold, however, with higher beta.” With the Federal Reserve’s meeting looming next week, macroeconomic factors are expected to take center stage temporarily.
Yesterday’s US Producer Price Index (PPI) data, showing a 0.6% increase in February and surpassing forecasts of 0.3 month-over-month, has caused a ripple effect with CPI recently also hotter than expected, leading to a rise in US bond yields. The benchmark 10-year rate saw an increase of 10 basis points to 4.29%, while two-year rates rose to 4.69% from 4.63%. These developments have led traders to adjust their expectations for the Federal Reserve’s interest rate policies in 2024.
Mohamed A. El-Erian, from Queens’ College, Cambridge University, Allianz, and Gramercy, remarked on the situation: “US government bond yields jumped today in reaction to yet another (slightly) hotter-than-expected inflation print (this time PPI).” This suggests a growing awareness of the challenges that persistent inflation poses to achieving the Fed’s 2% inflation target.
#3 Negative Coinbase Premium / Quiet Bitcoin ETF Day
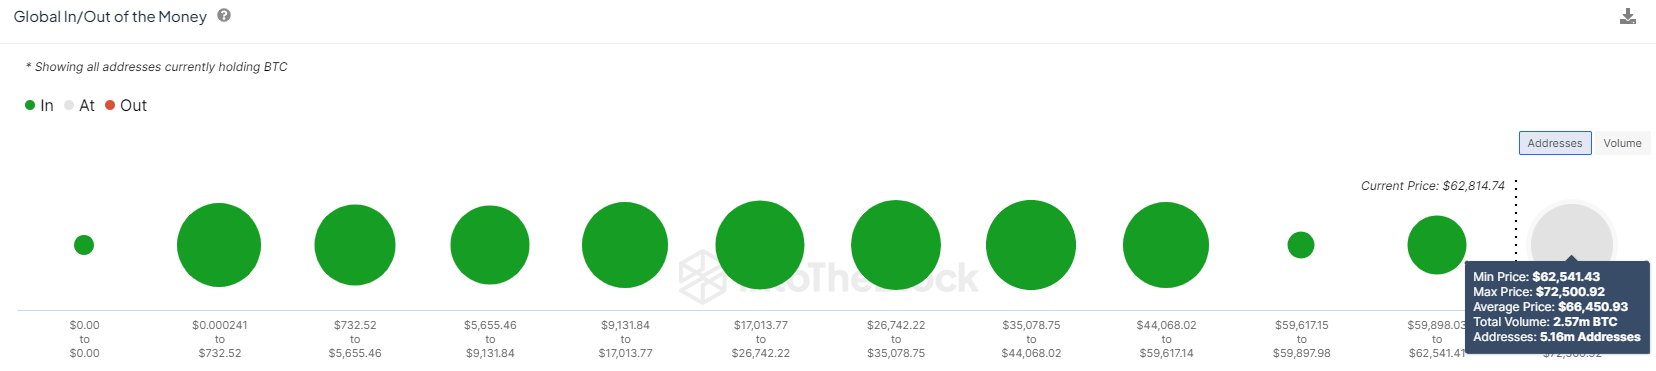
The decline of Bitcoin below the $70,000 threshold is also attributed to the “Coinbase Premium” – the exchange which custodies the majority of all spot Bitcoin ETFs – dipping into negative territory for the first time since February 26, indicating a bearish sentiment from US markets. This phenomenon is likely a consequence of significant sales of Grayscale GBTC, while the spot ETF experienced relatively calm activity.
Following a record $1 billion net inflow day for the spot ETF on March 12, inflows dropped to just $132.7 million recently, with Blackrock contributing the lion’s share at $345.4 million. Meanwhile, Fidelity and ARK saw minimal inflows of $13.7 million and $3.5 million respectively, after a previously strong week. GBTC outflows were reported at $257.1 million, aligning with average levels.
Crypto analyst WhalePanda commented on the situation, noting that despite the reduced inflow, “$132.7 million is still 2 full days of mining rewards.” He suggests a potential rebound in the market, stating, “We’re just ranging now and overleveraged people getting margin called. I guess the next move up is for next week.”
At press time, BTC traded at $67,916.
Featured image created with DALL·E, chart from TradingView.com
Disclaimer: The article is provided for educational purposes only. It does not represent the opinions of NewsBTC on whether to buy, sell or hold any investments and naturally investing carries risks. You are advised to conduct your own research before making any investment decisions. Use information provided on this website entirely at your own risk.
The cryptocurrency market continues its summer swoon, with major coins like Bitcoin tumbling to four-month lows. Chainlink (LINK), a key player in the decentralized oracle network space, has been especially hard-hit, dropping 25% since the beginning of June. But is this a buying opportunity, or the precipice of a steeper decline?
Related Reading
This Chart Pattern Looms Large
Technical analysts are scrutinizing Chainlink’s chart, with a particular focus on the dreaded “Head and Shoulders” pattern. This formation, characterized by a central peak flanked by two smaller ones, often signals a trend reversal from bullish to bearish. Analyst Ali Martinez believes a breach of the neckline, the support level currently hovering around $12.70, could trigger a significant downturn.
#Chainlink $LINK faces a potential 45% price correction if it falls below $12.70! pic.twitter.com/8NGwMzEIhR
— Ali (@ali_charts) July 4, 2024
If LINK falls below $12.70, we could see a cascading sell-off, warns Martinez. This could push the price down to $6.80, a staggering 45% drop. Fibonacci retracement levels, a technical tool used to identify potential support and resistance zones, further bolster this bearish outlook. The 0.786 Fibonacci level aligns perfectly with Martinez’s target of $6.80, lending credence to his prediction.
Bearish Sentiment Grips The Market
Adding fuel to the fire is the overall bearish sentiment gripping the crypto market. The Fear and Greed Index, a measure of investor sentiment, currently sits at a chilling 26, firmly in “Fear” territory. This fear is reflected in LINK’s trading activity. The price is struggling to stay above the critical $12.70 mark, and any decisive break below could accelerate the sell-off.
A Glimmer Of Hope: Oversold Territory And Price Prediction
However, a glimmer of hope remains. The Relative Strength Index (RSI), another technical indicator, suggests LINK might be oversold. The RSI is currently at 28, dipping into “oversold” territory. This could signal a potential short-term bounce, as oversold assets often experience temporary price corrections.
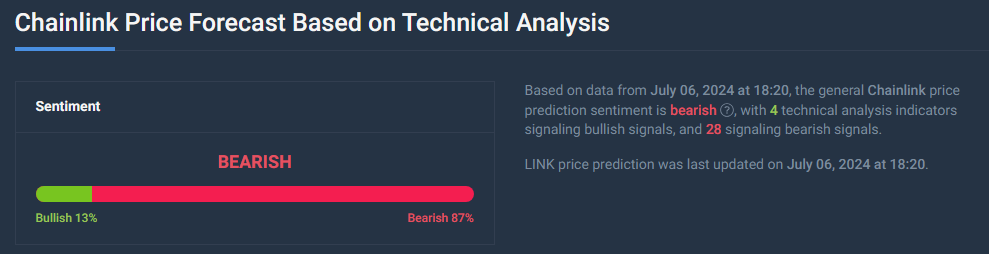
Interestingly, some analysts contradict the prevailing bearish sentiment. Price for LINK is seen increasing 52.73% by August 5th, pushing the price to a healthy $18.97. While technical analysis paints a bleak picture, this prediction offers a counterpoint, highlighting the inherent uncertainty within the crypto market.
Related Reading
The Road Ahead For LINK
Ultimately, the future of Chainlink remains shrouded in uncertainty. Technical indicators scream caution, while some analysts maintain a bullish outlook. The coming weeks will be crucial for Chainlink. Will it defy the bearish whispers and stage a comeback, or succumb to the gravitational pull of a deeper correction?
Featured image from Coldkeepers, chart from TradingView

Semilore Faleti is a cryptocurrency writer specialized in the field of journalism and content creation. While he started out writing on several subjects, Semilore soon found a knack for cracking down on the complexities and intricacies in the intriguing world of blockchains and cryptocurrency.
Semilore is drawn to the efficiency of digital assets in terms of storing, and transferring value. He is a staunch advocate for the adoption of cryptocurrency as he believes it can improve the digitalization and transparency of the existing financial systems.
In two years of active crypto writing, Semilore has covered multiple aspects of the digital asset space including blockchains, decentralized finance (DeFi), staking, non-fungible tokens (NFT), regulations and network upgrades among others.
In his early years, Semilore honed his skills as a content writer, curating educational articles that catered to a wide audience. His pieces were particularly valuable for individuals new to the crypto space, offering insightful explanations that demystified the world of digital currencies.
Semilore also curated pieces for veteran crypto users ensuring they were up to date with the latest blockchains, decentralized applications and network updates. This foundation in educational writing has continued to inform his work, ensuring that his current work remains accessible, accurate and informative.
Currently at NewsBTC, Semilore is dedicated to reporting the latest news on cryptocurrency price action, on-chain developments and whale activity. He also covers the latest token analysis and price predictions by top market experts thus providing readers with potentially insightful and actionable information.
Through his meticulous research and engaging writing style, Semilore strives to establish himself as a trusted source in the crypto journalism field to inform and educate his audience on the latest trends and developments in the rapidly evolving world of digital assets.
Outside his work, Semilore possesses other passions like all individuals. He is a big music fan with an interest in almost every genre. He can be described as a “music nomad” always ready to listen to new artists and explore new trends.
Semilore Faleti is also a strong advocate for social justice, preaching fairness, inclusivity, and equity. He actively promotes the engagement of issues centred around systemic inequalities and all forms of discrimination.
He also promotes political participation by all persons at all levels. He believes active contribution to governmental systems and policies is the fastest and most effective way to bring about permanent positive change in any society.
In conclusion, Semilore Faleti exemplifies the convergence of expertise, passion, and advocacy in the world of crypto journalism. He is a rare individual whose work in documenting the evolution of cryptocurrency will remain relevant for years to come.
His dedication to demystifying digital assets and advocating for their adoption, combined with his commitment to social justice and political engagement, positions him as a dynamic and influential voice in the industry.
Whether through his meticulous reporting at NewsBTC or his fervent promotion of fairness and equity, Semilore continues to inform, educate, and inspire his audience, striving for a more transparent and inclusive financial future.

The cryptocurrency market witnessed a significant setback as the Bitcoin price plummeted below the $58,000 level. This downward move has raised concerns among bullish investors, suggesting a potential continuation of the downtrend toward the $44,000 support level.
Bitcoin’s failure to consolidate above and retest its all-time high (ATH) of $73,700, reached in March, has resulted in a retracement of over 20% on the monthly time frame.
Bitcoin Price At Risk
Crypto analyst “Blockchaineddbb” has provided a noteworthy assessment of the situation. According to the analysis, a daily close below the 200 daily exponential-moving average (EMA), currently positioned at $58,000, indicates a strong likelihood of Bitcoin’s price dropping to $44,000.
The analyst cautions against waiting for a bounce after the daily close below the 200 daily EMA, emphasizing the historical significance of such a breach.
Related Reading
Blockchaineddbb’s analysis reveals the historical impact of losing the 200 daily EMA. Each time Bitcoin experienced this loss, its price declined by an average of 30%, with losses ranging from 8% to 50%.
The breach of the 200 daily EMA signifies Bitcoin entering an unsafe territory, heightening investor concerns. To mitigate potential losses, the analyst suggests considering an exit point before the expected further decline to $50,000, which is the next significant support level.
Navigating The Bearish Storm
Blockchaineddbb provides average support levels to consider during the bearish sentiment for those who choose to hold their positions.
These levels are estimated at $50,000, $48,000, and $44,000, with the latter being the worst-case scenario. Long-term holders are advised to adhere to their planned averaging strategy, which involves accumulating positions on specific dates such as June 22, September 22, and December 22.
According to the analyst, the target exit price remains at $75,000, with expectations of achieving this milestone by December.
Considering various factors, such as a predicted September dump, the Mt. Gox settlement deadline, and upcoming elections, the analyst suggested that the prevailing bearish sentiment will persist until December.
Related Reading
Ultimately, if the current bearish sentiment continues, altcoins are expected to suffer losses until the year’s end. It is worth noting that a potential shift in this scenario would only occur if Bitcoin manages to close above the 200 Daily EMA. However, the probability of that happening appears low.
Currently, the Bitcoin price stands at $56,435, just below the critical $58,000 EMA, after falling as low as $53,500 in the early hours of Friday trading.
Featured image from DALL-E, chart from TradingView.com


-
 Hot Projects4 months ago
Bitcoin Blasts Past $70,000 to Register New All-Time High | MATIC News
-
 Latest News4 months ago
Court upholds SEC’s unregistered securities claims against Gemini, Genesis’ Earn program | MATIC News
-
Hot Projects2 months ago
Bitcoin Will Be Set For New ATHs If It Breaks This Resistance: Analyst | MATIC News
-
 Latest News2 months ago
Six Coinbase customers claim the exchange is violating securities laws in new lawsuit | MATIC News
-
 Hot Projects3 months ago
Bitcoin ETF Inflows Could Eclipse $1 Trillion, Predicts Bitwise CIO | MATIC News
-
 Hot Projects3 months ago
Ondo Finance Joins BlackRock Tokenized Fund As Inflows Surpass $160M | MATIC News
-
 Latest News4 months ago
Over $1 billion wiped off HEX’s valuation following Richard Heart’s disparaging remarks | MATIC News
-
 Latest News2 months ago
New Hampshire representative proposes Bitcoin ETF investment to address state financial liabilities | MATIC News